On Wednesday, Jason Leopold tweeted this image that had been released by the White House:
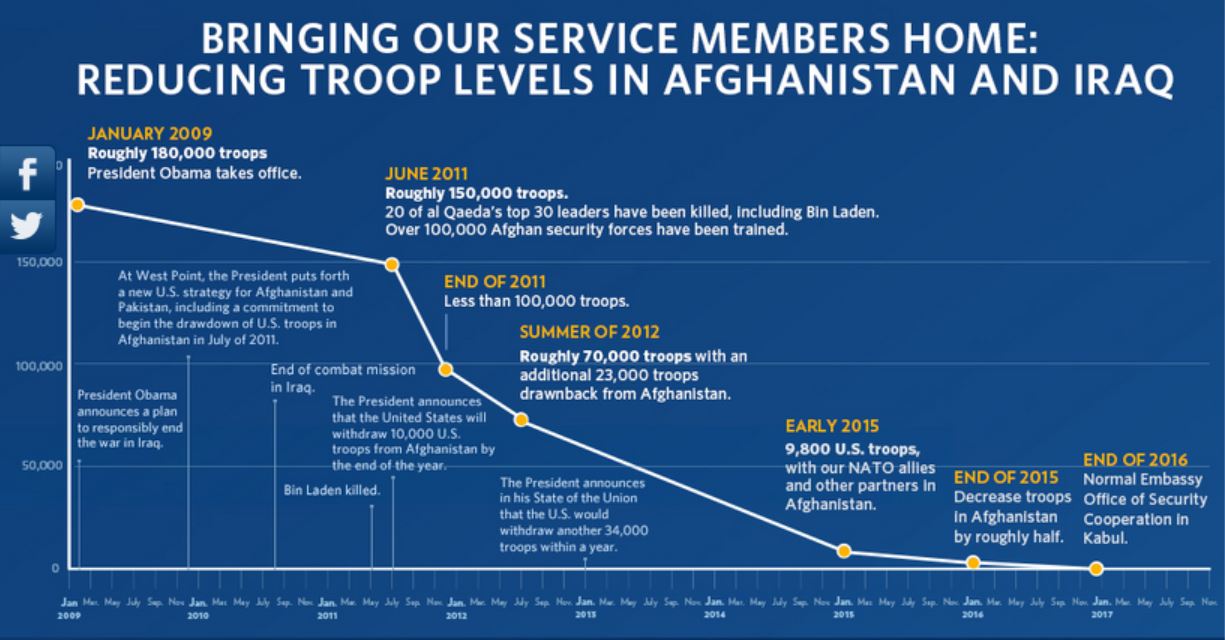
What surge?
Marcy quickly responded, “Funny how you can graph surge out of existence.”
So how did the White House make Obama’s surge of troops into Afghanistan disappear? Consider this graph of troop levels in Afghanistan, where we see the surge of US troops into Afghanistan standing out clearly:

Afghanistan troop levels.
This graph shows what we are used to seeing for Afghanistan, where troop levels were only around 35,000 when Obama took office in 2009 and surged to almost 100,000 in 2010, remaining at that level through most of 2011, as well. So how did the White House hide this surge in their feel-good “bringing home the troops” message? They did it by making the graph include both Iraq and Afghanistan.
Here are the troop levels for Iraq:
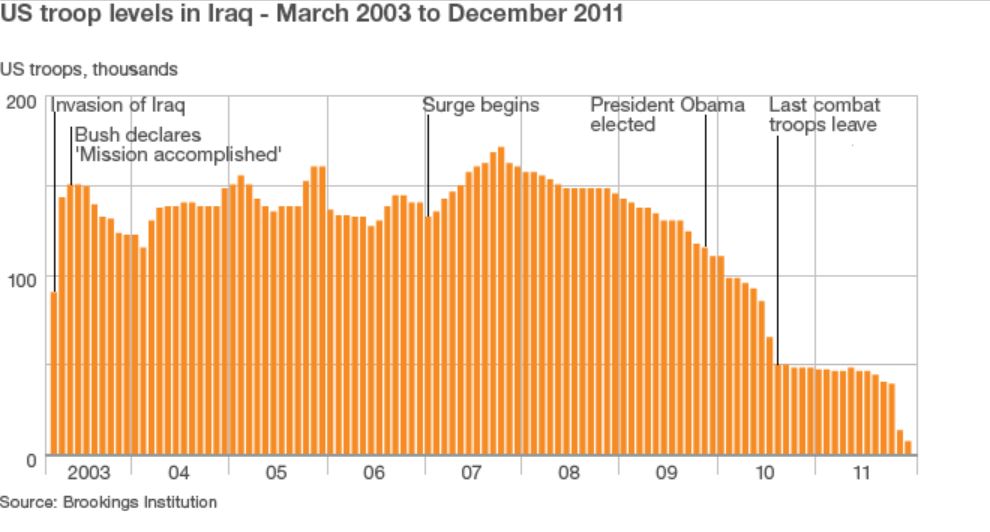
Iraq troop levels.
There were around 150,000 US troops in Iraq when Obama took office and by the time his Afghanistan surge (remember, Obama campaigned about Afghanistan being the “good war”) reached its peak in late 2010, Iraq troop levels had dropped to around 50,000 (although Obama waved his hand and declared that these were no longer “combat troops”). So, with a net loss of 100,000 troops in Iraq during the same time period, the White House was able to make it appear that the surge of about 65,000 troops into Afghanistan never happened.
Maybe next week the White House can graph that pesky inequality of capital distribution out of existence. I’m sure it will make us all feel richer.