Posts

No One Wants to Work [For You] Anymore: The End of Oligopsony

[NB: Note the byline above, thanks. /~Rayne]

There are few ways faster to piss me off than to say, “Slackers don’t want to work” in response to the lack of candidates for low-wage jobs.

This is what it looks like when a monopsonic or oligopsonic labor market is broken. It looks like workers can pick and choose the opportunity which best suits their needs rather than grabbing the first opportunity offered them because they are in precarity.

An oligopsony (from Greek ὀλίγοι (oligoi) “few” and ὀψωνία (opsōnia) “purchase”) is a market form in which the number of buyers is small while the number of sellers in theory could be large. This typically happens in a market for inputs where numerous suppliers are competing to sell their product to a small number of (often large and powerful) buyers. … [Wikipedia]

But there are more than one buyer (monopsony) or even very few buyers (oligopsony) of labor, you might say. Superficially you’d have a point.

Inside a one-mile stretch of the main thoroughfare where I live in Midwestern Suburbia, I can find 8-12 signs advertising job openings right now. I’ve lived here since the late 1970s and I’ve never seen this many postings for jobs.

Every single one of these jobs pays between $3.67 (Michigan’s minimum tipped hourly wage) and $15.00 an hour. None of them are full time, most have variable schedules, and only one place assures workers one weekend day off every week. None of them offer health care or childcare assistance of any kind. None of them offer enough hours regularly with enough compensation to pay for a one-bedroom apartment within walking distance, and likely not within a 10-mile radius.

Until the pandemic, these employers were able to tell workers what they’d pay, take it or leave it. They could act in concert without having to coordinate to set market pricing because it was simply understood by workers that hourly workers’ pay fell in this range and it was an employers’ market.

Employers have acted like a cartel, with collusion on price fixing for labor enabled by other monopolistic entities like Facebook and Google.

Workers may have thought they had some inside information through access to technology, but the same resources which informed them what to expect for compensation also told employers what to indicate as expected compensation. It told them what their competitors were paying.

Further, employers could buy the continuation of their high profits, I mean, low wage environment, simply by donating to a member of Congress directly or through a business association like the U.S. Chamber of Commerce. These same purchased entities also did their best over the last several decades to reduce workers’ rights and suppress unionization.

It’s been cheaper and more reliable to buy a GOP member of Congress than to increase automation or to pay workers a living wage.

It’s also worked so well for so long that idiots like Sen. Marco Rubio unquestioningly parrot employers’ complaints as plain fact, ignoring how many voters are workers while sucking up to potential business donors:


Never mind the cost of living for low-wage workers, though.


Seriously, Marco Rubio is a bought-and-paid-for moron who, along with the rest of the GOP, could give a shit about the lives of the working class.

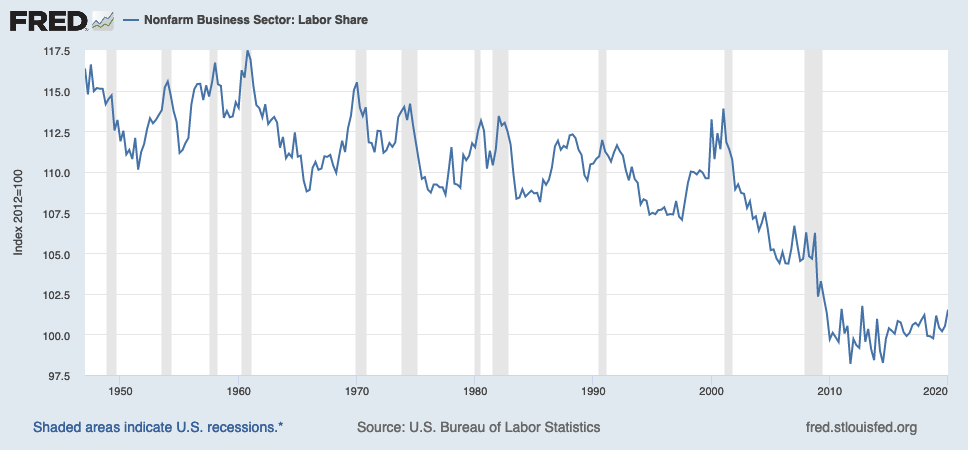
What the pandemic has done is broken the undocumented employer cartel and exposed the lack of bargaining power low-wage employees have had for decades. That unemployment compensation — a ridiculously low figure which doesn’t truly provide subsistence income — is more than what employers have paid these workers is revealing. They’ve gotten away with forcing precarity on workers to keep profits up, distorting whether their business models were legitimate. Some of the precarity is bound up in deliberately unlawful behavior including wage theft.

With a bare minimum of unemployment and pandemic aid, these workers have had breathing room to decide whether to go back to work and risk their health, or wait for more people to be vaccinated. They’ve had financial space to stay with their kids who still don’t have adequate childcare available or adequate support should schools need to transition back to remote classes on short notice.

These workers have also simply had enough — enough putting themselves at risk, jeopardizing their families’ health, enough of being bullied by employers and customers alike.


This is just pathetic — a sandwich? Employers are going to respond to all that’s wrong with current working conditions by chumming applicants with sandwiches?


McDonald’s franchises have been offering cash ranging from $50 in Florida to $500 in Pennsylvania to applicants who showed up for an interview. At least one franchise is alleged to have called the state’s unemployment bureau to turn in applicants who didn’t accept their employment offer, in an effort to terminate their unemployment benefits.

All these nasty anti-worker machinations just to avoid paying a living wage, which employers know is the reason they aren’t landing applicants:

So, in an effort to attract new employees, a Tampa McDonald’s is now promising $50 to anyone who just shows up for an interview.

Local McDonald’s franchise owner Blake Casper, who also owns Oxford Exchange, told Business Insider that a manager at his Dale Mabry and Chestnut location came up with the idea, but far so it hasn’t really yielded much success. …

Of course, one way to attract new employees is to just pay them more, and while he hasn’t done it yet, Casper told Business Insider he’s now considering raising starting wages to $13. As of now, according to a job posting on Indeed.com for the same Dale Mabry McDonald’s location, new employees can make up to $11.50 an hour.

Last year, more than 60% of Florida voters approved a constitutional amendment to raise Florida’s minimum wage to $15 per hour by the year 2026.

Workers clearly believe 2026 is too long to wait for a living wage — and $15 an hour in 2026 may not be a living wage by then, given the rate at which real estate investors have forced rental prices out of reach for low-wage workers.

Employers know better, and yet they have the goddamned balls to ask for more free labor:


Mind you, no more than three free days a month or the company might get in trouble — oh, and do be sure to dress like you’re being paid for it.

Workers would rather bust hump on their own, eat deterioration of their own vehicle and amortize it rather than take a minimum wage hourly job:


When they work as a contractor on a gig job, it pays better and their boss isn’t a bullying asshole who puts their safety at risk.

But of course the GOP has a problem with helping these small business persons with their tiny entrepreneurial aspirations who are trying to earn a living wage while not risking their physical and mental health:


Meanwhile, journalists aren’t asking key questions, rolling over and playing dead for the likes of Marco Rubio when he trots out the fascist conventional wisdom that workers are lazy. They aren’t asking businesses if they’re re-examining their business model the way workers have had to re-examine their priorities.


The least we and journalists should be doing: asking business-owned chumps like Rubio more pointed questions about employers, especially when they’re buying support yachts for their mega-yachts:

MMT On Inflation

Posts in this series
The Deficit Myth By Stephanie Kelton: Introduction And Index
Debunking The Deficit Myth

The second chapter of Stephanie Kelton’s The Deficit Myth deals with inflation. In Chapter 1, Kelton explains that the deficit is not a constraint on government spending. Instead, inflation is the important constraint. A deficit does not prove that the federal government is overspending. Only an increase in inflation proves Congress is overspending. Kelton says Congress shouldn’t tax and spend so as to deliver a balanced budget. Congress should spend and tax so as to deliver a balanced economy, one that serves all of us. She says that historically we have not done this, that we have chosen to focus of deficits and in so doing our economy has not served us well.

Definition and Description of Inflation

Inflation means a continuous rise in the price level. A bit of inflation is considered harmless and even something economists like to see in a healthy, growing economy. But if prices start rising faster than most people’s incomes, it means a widespread loss of purchasing power. Left unchecked, this would mean a decline in society’s real standard of living. In extreme cases, prices can even spiral out of control, gripping a country in hyperinflation. P. 44.

The danger of eroding incomes explains why everybody worries about inflation, and explains why politicians can use the threat of inflation to terrorize voters. It works, even though the problem for more than a decade hasn’t been too much inflation, it’s been too little. Ever since the Great Crash inflation has been less than 2% annually despite efforts of the Fed.

Kelton says that economists think of inflation as either cost-push or demand-pull. Demand-pull inflation occurs when consumer spending rises faster than the economy can produce goods and services. That hasn’t been a problem for a long time. Cost-push inflation can arise from disasters, which reduce the supply of something; from pricing power, as in the case of Big Pharma with its patents and trade secrets; or from workers gaining market power and demanding higher wages which businesses pass on to consumers. That last one is the only fear mainstream economists suffer, as far as I can tell.

The dominant theory of inflation stems from Milton Friedman’s monetarism:

According to Friedman, “inflation is always and everywhere a monetary phenomenon.” What he meant was that too much money is the culprit in any inflationary episode. If prices weren’t stable, it was because the central bank was trying to force the economy to create too many jobs by allowing the money supply to increase too rapidly.

The early neoliberal Friedman insisted that the Fed must never interfere with the workings of the market. Specifically, the Fed should not try to reduce unemployment below a certain level, which came to be called NAIRU, the non-accelerating inflationary rate of unemployment. Friedman thought there had to be some minimum level of unemployment in the economy. [1] The Fed bought into this view, as did politicians of all stripes. They all agreed that to keep prices stable, the US has to accept a certain level of unwanted unemployment. And to be on the safe side, maybe a bit higher level of unemployment. In practice, Congress dumped the problems of inflation and unemployment on the Fed.

But problems arose. The NAIRU isn’t visible or measurable. It can only be seen in retrospect. And now we are pretty sure there isn’t a clear relationship between inflation and unemployment, as the Fed assumed. [2] The Fed Chair, Jerome Powell, freely admitted to Rep. Alexandria Ocasio-Cortez that the Fed has been wrong about NAIRU, but defended its use on the grounds that “We need to have some sense of whether unemployment is high, low or just right.” P. 53.

2. The Problem of Unemployment

It turns out that the Fed used the purported correlation between inflation and unemployment as its primary tool for controlling inflation, ignoring all other causes of inflation. When the economy heated up and unemployment dropped, workers gained market power, and their share of national income increased. That led the Fed to raise interest rates leading to a tightening of the economy and usually a recession, as the following chart shows.

Gray bars indicate recessions.


Kelton calls this a “human sacrifice”, forcing some people out of the workforce when they want to work and can be productive. She thinks we are asking too much of the Fed. It can’t spend money into the system; only Congress can do that. All the Fed can do is change the cost of borrowing. If unemployment is too high, the Fed can make borrowing cheaper, but it can’t force anyone to borrow. Usually when unemployment is high, no one wants to borrow. I note that this was what happened after the Great Crash. The Fed cut interest rates to zero and lowered bank reserve requirements, hoping to increase money going into the economy. It didn’t work.

3. The Job Guarantee

Kelton argues that a better way to deal with unemployment is a job guarantee. Every person who wants to work should be able to get a decent job with decent pay and decent benefits. If the private sector won’t provide those jobs, the government should. [3] Kelton discusses this idea and its foundations.

It would probably be impossible for Congress to monitor the economy closely enough to manage full employment by tweaking taxes and spending. A job guarantee would act as a safety-valve and an automatic stabilizer for the economy and help solve this problem, leaving the Fed free to focus on inflation. If the private sector needs all the workers it can find them. If not, the government hires people to do jobs that need doing. There is plenty of work that needs doing, and, as Kelton pointed out elsewhere, we can always use more flowers in our parks and boulevards.

4. Preventing Inflation

So how should Congress budget knowing that the only effective constraint on spending is inflation? What would change? The way Congress currently works is that every bill that calls for expenditures gets a score from the Congressional Budget Office that assesses the impact of the expenditure on the deficit over a ten-year period. If inflation were the constraint, then the CBO would offer a score based on the probable impact of the expenditure on inflation. If the economy is, as now, operating well below its capacity for producing goods and services, the possibility of inflation would be low.

If the economy is close to capacity, either as a whole or in part related to the area of expenditures, then Congress has to make hard calls. How important is the expenditure? Can we create “fiscal space” for the expenditure with taxes? For example, in the case of the entire economy humming along, a general income tax hike would take money out of most people’s hands so they would not be buying as much, leaving room for the government to buy more. If there is a bottleneck, a more focused tax or some other step might be necessary.

Conclusion

MMT recognizes that inflation is a crucial problem. It shows how it arises and how we should protect ourselves from it.

=====
[Graphic via Grand Rapids Community Media Center under Creative Commons license-Attribution, No Derivatives]

[1] Marx said that the reserve army of labour is a necessary part of capitalism. Hmmm.

[2] This relationship is embodied in the Philips Curve. I discuss it here.

[3] Other economists favor a universal basic income. Both have the added benefit of freeing workers from abusive or irritating employers. Your family won’t starve if you walk out on a bad situation.

The Slow Death of Neoliberalism: Part 3 The Phillips Curve and Critical Theory

Part 1.
Part 2.

I described attacks on the Phillips Curve in Part 2. This part discusses the history of the Phillips Curve in detail, and concludes with a discussion of the problems revealed by the failure. The Observations are the fun part if this is too long.

History of the Phillips Curve

This section is based on parts 1-3 of The History of the Phillips Curve: Consensus and Bifurcation by Robert Gordon, an economist at Northwestern, published in the 2008 in the journal Economica at p. 10 et seq. (behind paywall, but available online through your local library). In 1958, William Phillips published a paper which as Gordon puts it,

… replaced discontinuous and qualitative descriptions by a quantitative hypothesis based on an unusually long history of evidence. Since 1861 there had been a regular negative relationship in Britain between the unemployment rate and the growth rate of the nominal wage rate. P. 12.

Phillips fitted a curve to data from the period 1861-1913, and plotted data for the remaining periods, through 1957 against that curve to find disagreements. Phillips found that his curve was close across the entire time except for a couple of years that he explains away. Here’s the curve Phillips fitted to his data:

1) wt = -.90 + 9.64U-1.39

Gordon says “… the inflation rate would be expected to equal the growth rate of wages minus the long-term growth rate of productivity.” P. 12.

1a) p = w – k

For some reason p is inflation and k is productivity. Upper case letters are levels and lower case letters are rates of change. So equation 1 can be written

2) p = -.90 + 9.64U-1.39 – k.

Paul Samuelson and Robert Solow discussed the Phillips results in the US context in a 1960 article. They found no similar data for the US, but they did some estimates and suggested that the PC doesn’t fit their data for several periods, and that it can shift up and down. Phillips estimated that an unemployment rate of about 2.5% was consistent with zero-inflation, while Samuelson and Solow think it might have been 3% pre-World War II and was about 5-6% in the early 60s.

With this seal of approval, the idea was incorporated into econometric models in two equations. In one, the PC was embodied and other variables were added, including demand, unemployment, the rate of change of unemployment, taxes, expected inflation and others in different combinations. This result was fed into an equation that calculates inflation based on wage levels, price levels and trend productivity. Gordon explains that

The reduced form of this approach implied that the inflation rate depended on the level and rate of change of unemployment, perhaps other measures of demand, and lagged inflation.

This is followed by a long discussion of the views of the Chicago School, which Gordon dismisses as utter failures. Moving along to 1975, Gordon turns to efforts to modify the Phillips Curve by adding supply and demand shocks. The price of oil shot up in 1973 because of OPEC. The demand for oil doesn’t decrease quickly in the short run, so people spend more on oil and less on other things. The Phillips Curve didn’t predict the results. Gordon says

The required condition for continued full employment is the opening of a gap between the growth rate of nominal GDP and the growth rate of the nominal wage to make room for the increased nominal spending on oil. P. 21, cite omitted.

That means wages must fall, Gordon says, or we have to add money to the economy, but the latter would lead to inflation. What we actually did, he says, was wage rigidity, increased unemployment, and some nominal (meaning not adjusted for inflation) GDP growth. Gordon then developed and published this version of the Phillips Curve:

3. pt = Ept + b(Ut – UtN) + zt + et

The second U term is the “natural” rate of unemployment, which I’m not going to take up. The z term represents cost-push pressure from unions and supply monopolies. The e term is apparently a constant but it seems odd that it might vary over time. Gordon explains that this version incorporates inertia, the idea that if there’s inflation in one period, there will be inflation in the next. It also reflects supply and demand issues, like wage and price rigidity.

Gordon then mentions in passing that the wage equation (Equation 1a) is only valid if labor’s share of the GDP is fixed, but it isn’t. Here’s a chart from FRED

That problem, says Gordon, is “fruitfully ignored”. We don’t need to consider wages, we just look at prices. With these changes, we can understand the past by explaining away variations with negative or “beneficial supply shocks” and other variables. Gordon says that Equation 3 is foundation of the mainstream model. There is a related model, the New Keynesian Phillips Curve which is similar except that it incorporates future expectations of inflation, and makes no specific provision for supply and demand shocks. I assume these in some combination are the models used by the Fed, and heavily criticized as discussed in Part 2.

Observations

The concept is replaced by the formula, the cause by rules and
probability. Dialectic of Enlightenment, Horkheimer and Adorno,p. 3.

1. Phillips was working off empirical data when he fitted his curve, data about inflation and the rate of growth of wages. There are some theoretical issues in the preparation of that data. But the only abstract theory he adds to his data is Equation 1a, which Gordon says has a solid base in intuition. At the time he was writing, Phillips would only have seen data supporting that theory. We have new information:

As it happens, and perhaps not surprisingly, Phillips’ Equation 1 doesn’t work on US data. Gordon himself and others start adding things to make the Philips Curve work. They are convinced that there is a link between unemployment and inflation, and that they just need to add the relevant variables from their theoretical arsenal to get it to come out. Some focus on expectations, others on supply and demand shocks, and others add taxes or something else. Once they get those pesky variables set up, it’s just a matter of solving for constants. The point is to fit a curve to the actual data, not to use the actual data to see what’s happening. The concept connected to the real world is gone, replaced by the formula. The cause is replaced by the rules of economics.

2. If we set inflation at 0 in Equation 1a, the rate of wage growth is equal to the rate of productivity growth. As the above chart shows, this relationship broke about 50 years ago. If all the gains from productivity are not going to labor, they are going to capital. Of course, capital takes several forms, for example, housing, agricultural land and other domestic capital. See, Piketty, Capital in the Twenty-First Century, Figure 4.6. When you think about it, it seems almost impossible that some of the gains from productivity weren’t going to capital all along. But in the current economy, it’s obvious that companies like Facebook can provide vastly more services with disproportionally fewer additional employees, few of whom are well paid, so that most of the gains from increased sales go to capital. Or, suppose that manufacturing is outsourced, reducing labor costs. Some of the gains might go to cutting prices but surely some go to capital. Let’s rewrite Equation 1a to reflect this, using γ for the growth rate capital.

1b) p = w + γ – k.

Using Equation 1b instead of 1a, we would have this instead of Equation 2:

4) p = -.90 + 9.64U-1.39 + γ – k.

This equation focuses attention on the changes in the return to capital. That issue never seems to trouble most economists, but the rate of return to capital is the central focus of Piketty’s Capital In The Twenty-First Century. This chart from the Center on Budget and Political Priorities shows that top wealth started on its climb at the same time wages diverged from productivity, which supports the idea that gains from productivity are going to capital:

It also calls attention to the fact that nowhere in Gordon’s paper is there a mention of power, market power, political power, or social power, all of which Piketty talks about. Actually, hidden away in Gordon’s article is a backhanded reference to power. Equation 3 (Equation 7 in Gordon’s paper) includes a term “…zt to represent ‘cost-push pressure by unions, oil sheiks, or bauxite barons’”. P. 22. Obviously Gordon understands that the power to control the price of goods and services could create a negative supply shock, and the loss of control could produce a beneficial supply shock. P. 25. However, this is not explicit, and it certainly doesn’t deal with our current economy, in which almost all goods and services are dominated by a small number of gigantic companies exercising a significant degree of price control.

The tweaking Gordon describes might work for a while, but as the degree of price control through monopoly and oligopoly power increases, and γ becomes a bigger factor, the tweaks quit working.

3. Let’s put this in a larger context. For many economists, the Phillips Curve is structural. But why would you think so? It seems more likely that the relationship holds in a certain set of social conditions, including legislation and regulation, power conditions, and people’s attitudes. A logical use of the data is to work out the conditions that must exist to make it so. That’s how Piketty approaches his inequality data.

It’s a mistake to use a coincidence to predict the future. It seems to be a particular problem in economics. Even people who seem to know better continue to believe in the Phillips Curve. Here’s the President of the Boston Fed, Eric Rosengren:

A number of papers at the conference highlighted that some of the economic relationships that are frequently assumed to be stable over time have proven to be not so stable as we have come out of the financial crisis. These structural changes mean that if you tried to have a model that was fairly invariant to these changes, or a process that was invariant to these changes, there would start being big misses in monetary policy.

He goes on to explain that we have to raise interest rates because maybe not the Phillips Curve, but when employment goes up, inflation goes up. Rosengren knows there’s a problem, but he doesn’t have any idea of how to cope, so he keeps doing what he thinks he knows is right. It’s another example of Horkheimer and Adorno’s statement in action.

Updated to define γ more exactly.

Mankiw’s Tenth Principle: Society Faces A Short-Run Trade-off Between Inflation and Unemployment

The introduction to this series is here.
Part 1 is here.
Part 2 is here.
Part 3 is here.
Part 4 is here.
Part 5 is here.
Part 6 is here.
Part 7 is here.
Part 8 is here.
Part 9 is here.

Mankiw’s tenth principle of economics is: Society faces a short-run trade-off between inflation and unemployment. He admits that this is more controversial among economists than his other principles. He says that most believe this explanation:

  • Increasing the amount of money in the economy stimulates the overall level of spending and thus the demand for goods and services.
  • Higher demand may over time cause firms to raise their prices, but in the meantime, it also encourages them to hire more workers and produce a larger quantity of goods and services.
  • More hiring means lower unemployment.

This line of reasoning leads to one final economy-wide trade-off: a short-run trade-off between inflation and unemployment.

This gives economic policy-makers a tool for influencing economic trends. “By changing the amount of money it prints”, says Mankiw, government can put more or less money into the economy, and thus influence unemployment, at least in the short run. The Great Crash of 2008 is an example. Mankiw explains that it was caused by “bad bets on the housing market”, and led to high unemployment and lower incomes. The Obama administration responded with a stimulus package of spending and tax cuts, and the Fed increased the amount of money in the economy, in an effort to reduce unemployment. He adds: “Some feared, however, that these policies might over time lead to an excessive level of inflation.”

The frightened people were, of course, proven absolutely wrong, though they won the policy argument with the imposition of the Sequester. The stimulus package was too small, though at least it more or less happened, and of course spending on the military increased, which helped, though it would have been nice to have something for the money besides the worthless F-35. This discussion is fleshed out beginning at about page 490 (in the 6th Ed.) with a long discussion of the Phillips Curve. This Wikipedia entry is at least cheaper than buying Mankiw’s book. for those not familiar with the subject.

This isn’t so much a principle in the sense of an axiom as it is a theorem, worked up from axioms. The source of the idea is a 1958 paper by William Phillips, showing an historical correlation between inflation and unemployment in the UK, and extended to US data by Paul Samuelson and Robert Solow. The correlation and the explanation worked together to persuade people that both the grounds of explanation and the relationship were more or less permanent features of the economy. The ideas behind the explanation are neoclassical, so the correlation served to validate those neoclassical ideas.

Recently the Wall Street Journal published an essay by Ben Leubsdorf discussing the current understanding of the Phillips Curve debate: The Fed Has a Theory. Trouble Is, the Proof Is Patchy. [Paywall]. Jared Bernstein discusses it in this post and links to this New York Times post; both are worth reading to see just how unhinged we are from the simple explanation offered by Mankiw. This chart is from the WSJ article.

Phillips Curve Chart 3

To read the chart, select an expansion, find the line in that color, and look for the circle, which is the beginning of the period. Then follow the line as it moves showing the changes in inflation (y-axis) and unemployment (x-axis). Here’s Leubsdorf’s explanation:

But the simple link between U.S. unemployment and inflation described by the Phillips curve appeared to break down after the 1960s. High inflation coexisted with high unemployment in the 1970s. In the 1990s, the jobless rate fell as price pressures weakened. Over the past three years, inflation has declined despite a falling jobless rate.

Mankiw says there is dispute among economists about this, and Leubsdorf confirms that. He says that a recent WSJ survey found that 2/3 of economists “believed that the link exists.” Here’s a quote from a believer, Atlanta Fed President Dennis Lockhart.

“In the absence of direct evidence that inflation is in fact converging to the target and in the absence of compelling or convincing direct evidence, I think a policy maker has to act on the view that the basic relationship in the Phillips curve between inflation and employment will assert itself in a reasonable period of time as the economy tightens up ….

Economists are fully aware of the problems with the Phillips Curve, and there are plenty of attempts to make it better. This is from the conclusion of an April 2015 Working Paper by Laurence Ball and Sandeep Mazumder of the International Fund:

One of Mankiw’s (2014) ten principles of economics is, “Society faces a short-run tradeoff between inflation and unemployment.” This tradeoff, the Phillips curve, is critically important for monetary policy and for forecasting inflation. It would be extraordinarily useful to discover a specification of the Phillips curve that fits the data reliably. Unfortunately, researchers have repeatedly needed to modify the Phillips curve to fit new data. Friedman added expected inflation to the Samuelson-Solow specification.

Subsequent authors have added supply shocks (Gordon, 1982), time-variation in the Phillips-curve slope(Ball et al., 1988), and time-variation in the natural rate of unemployment (Staiger et al.,1997). Each modification helped explain past data, but, as Stock and Watson (2010) observe, the history of the Phillips curve “is one of apparently stable relationships falling apart upon publication.” Ball and Mazumder (2011) is a poignant example.

Even today people are looking for a way to find something useful in past data to predict future outcomes. As Leubsdorf noted, the Fed is using some version of this curve in deciding when to raise interest rates.

So, how does this fit with neoliberalism? One of the goals of neoliberal economics is the protection of established wealth. Inflation erodes wealth. Returns to capital may or may not keep up with inflation, depending on the strength of labor and other factors of production. Debtors are able to repay their debt in less valuable dollars, which erodes the assets of creditors. If the increased returns are less than the erosion, wealth suffers. As we have seen in the wake of the Great Crash, the governing power structure of neoliberalism demands that capital be protected whether in the form of equity or debt. This principle tells policy makers to put people out of work rather than suffer inflation.

The Fed follows this principle. This is a chart of the labor share of income.
labor share 1
The gray vertical bars are recessions. The chart shows that as the labor share rises, we get a recession. The following chart shows bank prime rates.
Bank Prime Rate
As interest rates rise, we get recessions. With the exception of the recession that followed the Great Crash, it’s fair to say that all of these recessions were engineered by the Fed because of inflation or fear of inflation.

The implications are fascinating. Before the Great Crash, almost all US money was created by bank lending and credit expansion. Mankiw’s Principle No. 9 tells us that when too much money is created, we get inflation. The Phillips Curve tells the Fed it has to raise interest rates to stem inflation, and that it does so at the cost of putting people out of jobs. So, businesses lend and borrow too much, creating inflation or fear of inflation, and to solve the problem created by the failure of capitalists, the Fed makes sure only the working people pay the price, by losing their livelihoods, and lately, by watching their incomes stagnate or drop. And that is the outcome of applying Mankiw’s Principles of Economics: damaging workers to protect the rich.

Rick Scott Continues Struggle to Look Human, Endorses Medicaid Expansion While Infuriating Tea Party

Scott's attempts to look human are hampered by his striking resemblance to Voldemort.

Scott’s attempts to look human are hampered by his striking resemblance to Voldemort.

Rick Scott was elected Governor of Florida in 2010 by a razor-thin margin that many attribute to his strong support from the Tea Party movement. A large portion of that support was garnered through his highly public opposition to President Obama’s Affordable Care Act. However, with the small exception of my Congressional district electing batshit crazy Tea Partier Ted Yoho in 2012, it appears that the Tea Party is on a bit of a retreat in Florida and so, with Charlie Crist now looking like a very formidable opponent for the 2014 gubernatorial race, Scott is systematically reversing his position on a number of issues away from the crazy and toward both the human and the humane.

A huge step in Scott’s attempted move back toward humanity took place early yesterday evening, as he announced his support for Florida participating in expansion of Medicaid under the ACA. He even resorted to the death of his mother to justify the move:

The governor said he gained new perspective after his mother’s death last year, calling his decision to support a key provision of the Affordable Care Act a “compassionate, common sense step forward,” and not a “white flag of surrender to government-run healthcare.”

However, the representatives of Professional Crazy were not amused by this development. From the same AP article:

“I am flabbergasted. This is a guy who, before he was a candidate for governor, started an organization to fight ‘Obamacare’ in the expansion of medical entitlements. This is a guy who said it will never happen on his watch. Well, here it is,” said Slade O’Brien, Florida director of the conservative group Americans for Prosperity.

In other words, AFP notes that Scott was just one more of their huge investments that produced very poor returns.

And McClatchy brings us the Tea Party response, thankfully translated from the original jibberish:

“This is just another example of Republicans lying to Floridians,” said Everett Wilkinson of Palm Beach Gardens, calling Scott “the Benedict Arnold to the patriot and tea party movement in Florida.”

Of course, Florida’s Grifter in Chief (who still holds the record for the largest federal fine paid by a company for Medicare fraud) wouldn’t make this move if he couldn’t further enrich his old HCA co-conspirators or other corporate fraudsters, and so he has engineered a new opportunity. From the AP article: Read more

One Percent of All Americans Will Have Lost Unemployment by Month’s End

More than one percent of all Americans–3.3 million people–will have lost their unemployment benefits by month’s end if Congress doesn’t pass an extension of long-term benefits.

The Labor Department estimates that about 1.7 million have lost benefits as of last week, after extended unemployment insurance expired in late May. Those numbers could reach 3.3 million by the end of the month if Congress doesn’t pass an extension after it returns from recess next week.

[snip]

A bigger concern is the number of people who may lose benefits this month. The tally of people continuing to claim benefits plunged to 4.4 million, the department said. But that doesn’t include an additional 4.6 million people who received extended benefits paid for by the federal government in the week that ended June 19. That’s the latest period for which data are available.

Diane Swonk, chief economist at Mesirow Financial, said many people losing extended unemployment may seek aid through Social Security, food stamps and welfare.

Other economists noted that the end of extended benefits could cut Americans’ incomes by as much as $41 billion, potentially reducing consumer spending in the coming months.

Think about that for a minute. More than one out of every hundred people has been unemployed for so long the Republicans and deficit hawks in Congress think they’re just slacking and should be cut off. Of course, those one out of every hundred people aren’t evenly distributed throughout the population: the less educated, people of color, and people over 50 are suffering disproportionately during this recession.

Nevertheless, they represent a huge chunk of our neighbors, our customers, our family members. And our country seems to have decided they and those who depend on them are expendable.